Jae Hun’s Portfolio
This is a comprehensive list of my independent projects. It consists of multiple domains including Machine Learning, Web Scraping, Data Visualization and Streamlit Application. Clicking on the project title will direct you to the github repository for further details.
Machine Learning
Classification
JobCare Materials Usage Prediction - DACON Competition
Korea Employment Information Service runs an AI platform that analyzes job seekers’ traits and provides them with proper trainings, consultings and support. In this competition hosted by KEIS, participants are expected to build binary classification models that predict whether people accessing their platform would decide to use the educational materials provided to support their job training.
The notebook on the repository walks through the Exploratory Data Analysis, feature engineering and model trainings. For the training models, I experimented with Logistic Regression, Random Forest Classifier, SVC, XGB Classifier, LDA and Catboost Classifier. The Catboost outperformed; in order to boost the performances, I used Optuna library for hyperparameter tuning. My submission placed me on the top 20% of the leader board.
Stock Movement Direction Classifier
To anticipate stock market is close to impossible. Stock market (or perhaps any other market where irrationality supercedes rationalitity) is the most whimsical, unpredictable field.
However, in a vain attempt to build a reliable, or at least a surviving mechanism that barely loses in the market, I have decided to derive several features, those of particular stock and those of commodities and indices that investors often refer to measure the sentiment of the market.
The project consists of feature engineering, model training and back tester, which tells the investors to either buy or sell 5 days prior to the next opening day. The back tester calculates hypothetically how much money would we earn or lose using models. The models used are random forest classifier and neural network. The greatest difficulty was that since observed variables in the past do not follow certain distributions, training on the train set easily overfits.
Regression
Used Car Listing Scraper & Price Prediction
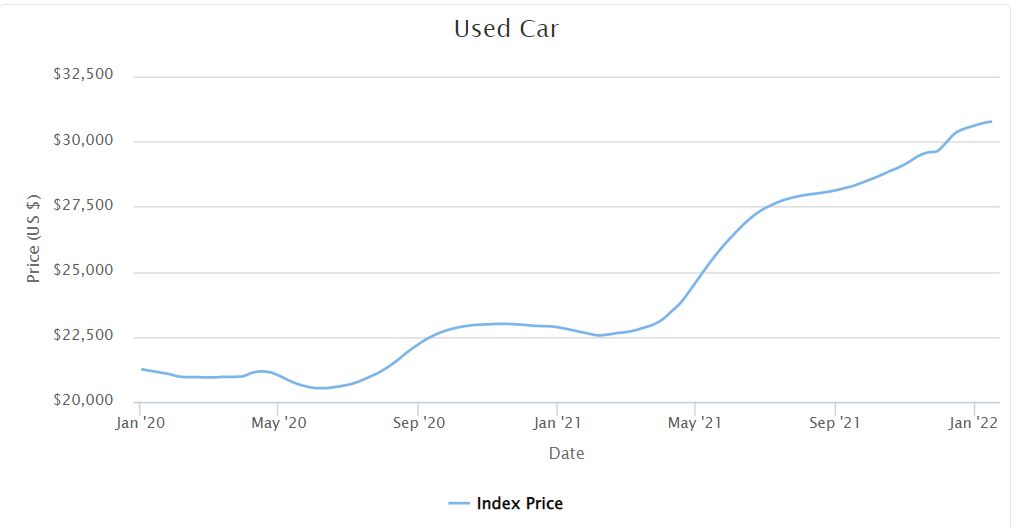
Source: cargurus.com
From the onset of Coronavirus pandemic, the U.S used car market has seen unprecedented rate of increase in the second hand automobiles’ prices. This phenomenon is mainly attributed to two causes: decreased production by automakers due to microchip shortages and increased demand from consumers returning to work. With prices still surging fast, buying a car has become more difficult, as knowing the benchmark price is harder; I decided to build a price predictor so that it will serve as a criterion for future purchases.
The project consists of two parts:
1) Scraper that gathers listings of used and new cars on cargurus.com
2) Feature Engineering, Model Training & Analysis of the Model Performances
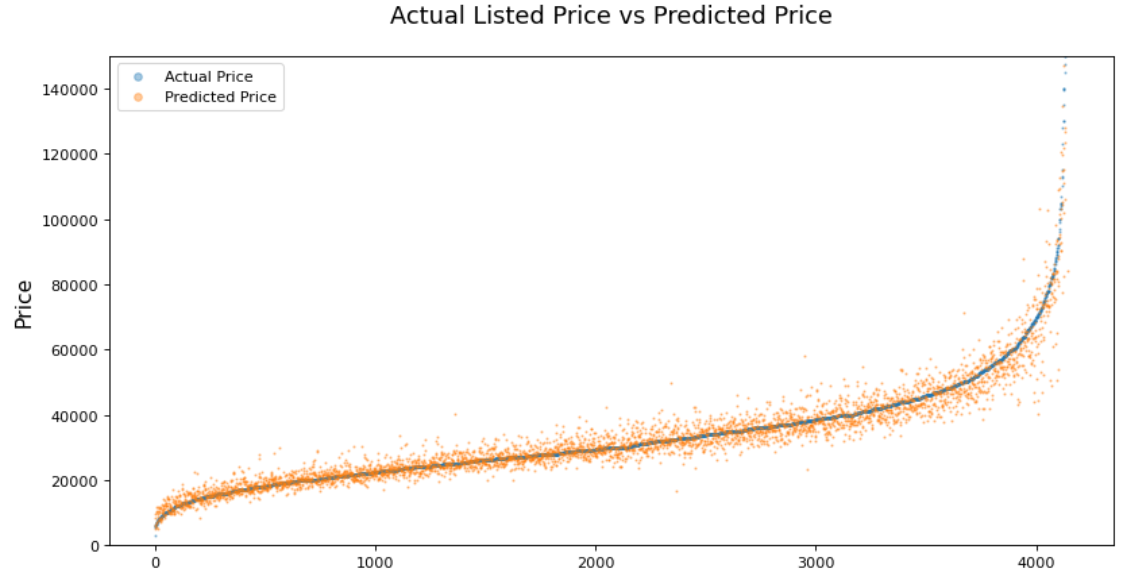
Due to the time & resources limit, the scraper collects information on ~40,000 vehicles recently listed on Cargurus. The information scraper collects information like car model name, mileage, make year, MSRP, color, included options and etc. Nearly 70% of the listings were missing MSRP (suggested retail price) - the most important feature in predicting the current prices. I created a separate MSRP scraper to gather as many MSRP data as possible for each model. Later, I mixed a few methods of imputations and encoders to enhance reliability of the features.
Based on more than 30 feature columns, I trained with 5 different regression models - Linear Regression, Polynomial Regression, Random Forest, Multilayer Perceptron & XGB. XGB regressor showed the highest precision after parameter tuning. The analysis part deep dives into how the model performed for respective brands and body types of vehicles.
Bulldozer Bluebook - Price Prediction
The project uses datasets from a previous competition on Kaggle, where participants were expected to predict the bluebook prices of bulldozers.
The most challenging aspect of the project was feature engineering. Some feature columns included erroneous data, while some others had more than 80% missing rows, for which I had to create customized imputation methods that account for different types of missingness. For regression models, I used Random Forest Regressor and XGB Regressor which displayed similar performances. Since this competition ended few years ago, I did not get to observe the model performances of the test data. However, prediction score (Root Mean Squared Logarithmic Error) on the validation set was comparable to the top of leader board.
Scraping & Visualization
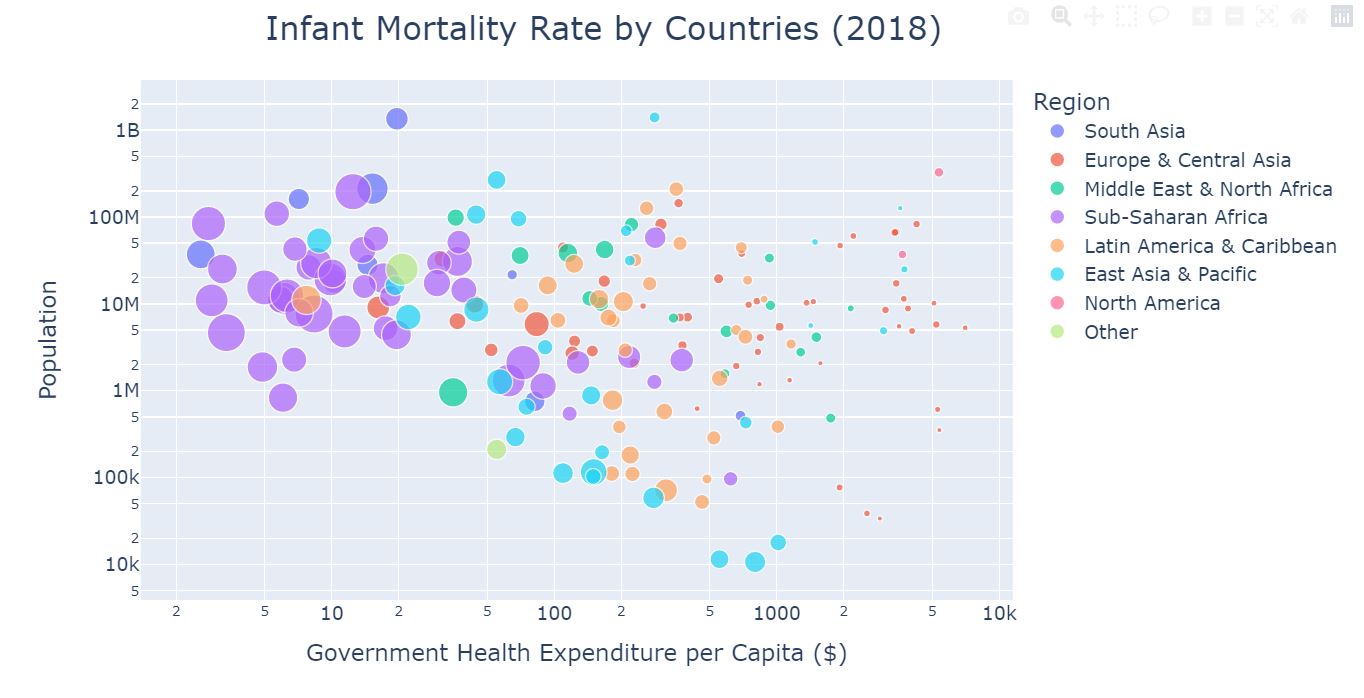
Health Nutrition and Population Statistics Visualization
Are qualities of human lives getting better overall? Especially in the developing regions, do humans now have better chances of survival? What about already developed countries with increasing life expectancy? By looking at the data from the World Bank, over the past six decades, I created several visualizations that display trends on infant mortalities, birth rates, populations by age bracket and etc. Through macroscopic analysis, I have discovered some obvious and some astounding changes that the world has seen recently.
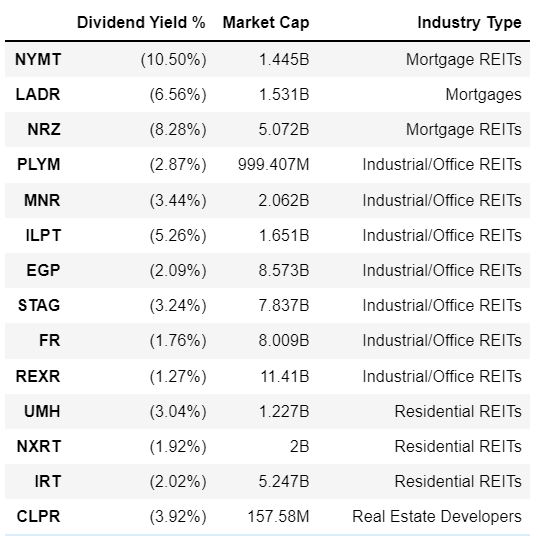
Stock Dividend Yield Scraper
I am currently investing in stocks, including Real Estate Investment Trusts (REITs). One of the most significant factors I consider when investing in REITs is their dividend yields. Depending on the types of industries the funds invest and their market capital, their profit sharing with the investors vary; I needed to build a simple table that will display list of dividend yields of each company, so that I can compare the returns as an investor and rebalance my portfolio.
Youtube Sentiment on Korean By-election Scraping
April 7th, 2021 was the day of by-election in South Korea. Most notably, it was the day that citizens of Seoul voted for the new mayor of Seoul - in a passage to the presidential election of 2022, for both parties, Democratic and People’s party (conservative), the importance of this particular election could not compare to that of any of the previous ones.
This year in particular, the public saw the prevalence of political opinions & voices on the internet more than ever - even the campaigns were allocating big chunk of their resources to promote their agenda on social media. To measure general public’s sentiment to the candidates, I decided to scrape data from YouTube, to observe basic statistics of hundreds of videos uploaded regarding two most prominent candidates. By analyzing the views, likes/dislikes ratio I attempted to visualize and compare the degree of interests (both positive and negatie).
Streamlit Application
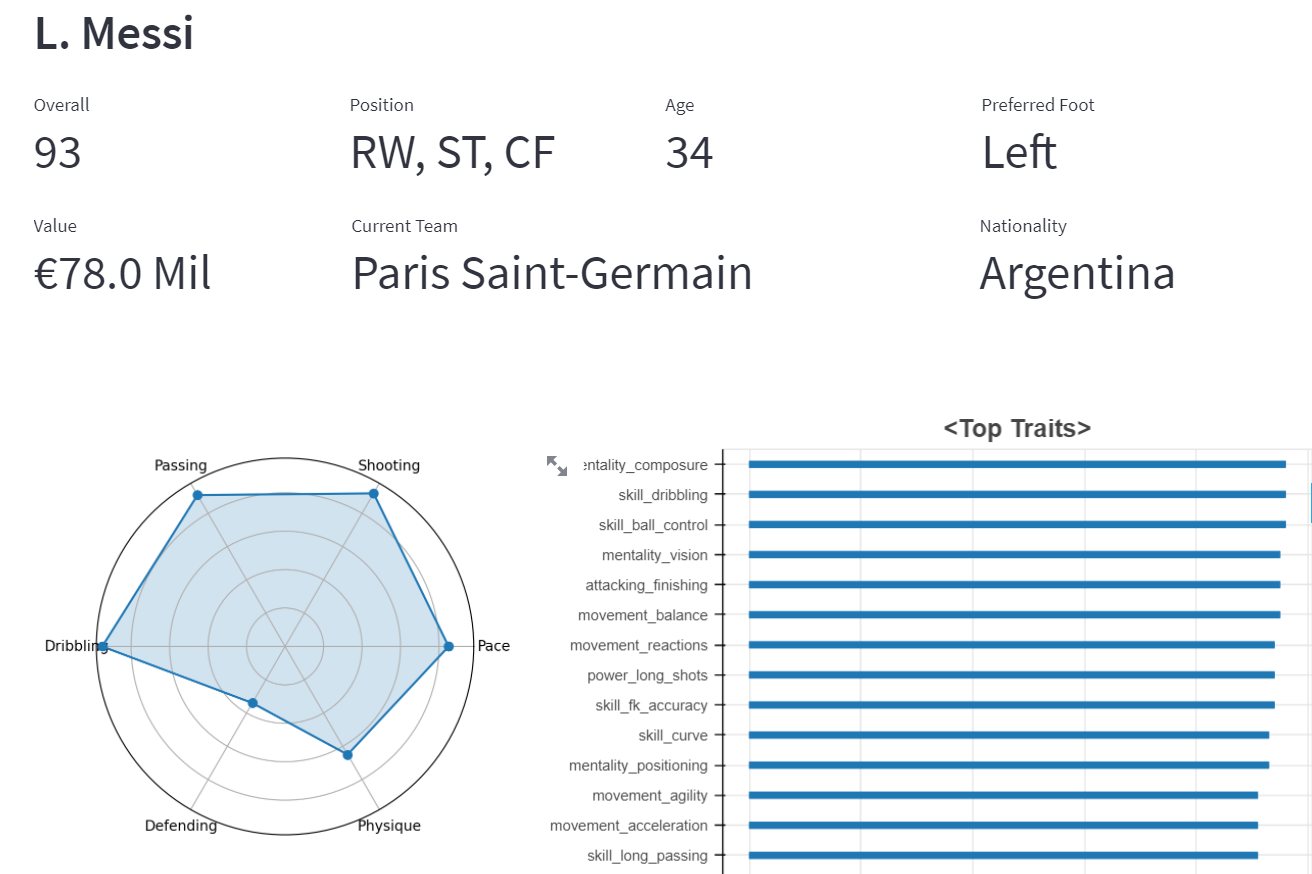
FIFA22 Player DB
As a serious FIFA player, I have to know the traits of each player to build an ideal team on a career mode. Ideally, I would love to create an All Star team with Messi and Ronaldo. However, it is not only expensive but also in fact, not so economical. The App I created through Streamlit helps users to improve their squads in two ways:
1) Visualize each player’s abilities and list other players with similar traits.
2) Filter players by the traits including their abilities, age, market value and etc.
With this tool, users can find a nice replacement for the world-class player at an affordable market value. Click here to access the App.
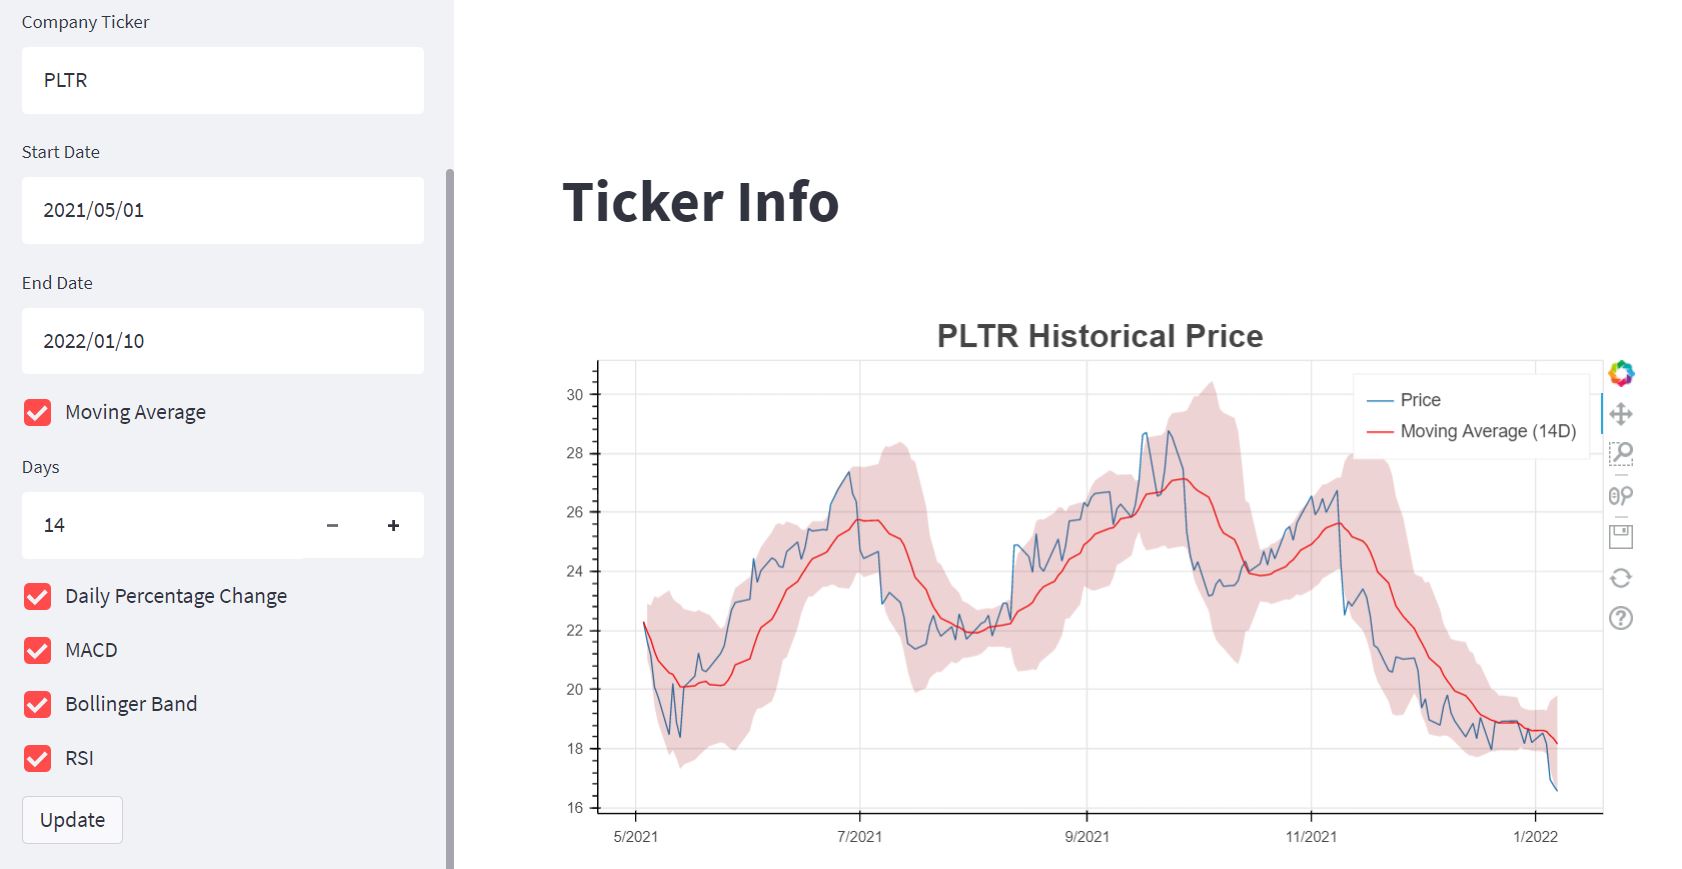
Stock Ticker Info & Price Charts
Based on the ticker symbol and user input date, the app displays price and technical indicators over user selected date range. It also provides ARIMA prediction on the future trends of prices. Click here to access the App.